ANNEX
This table does not contain a mathematical formula from the EU banking regulation, but rather financial market performance data.
Figure 1 Financial indicators
Note: Data as of 4.6.2020.
Sources: Refinitiv EIKON, ESMA.
{\\small\\begin{matrix}\\text{The image is a line chart showing stock market indices (EURO STOXX 50, NIKKEI 225, S\\&P 500, Global) over time, not a mathematical formula.}\\\\ \\text{Since no mathematical formula is present, an empty formula string is returned.}\end{matrix}}
Figure 2 Stock indices worldwide
Note: Equity prices. 2.2.2020 = 100.
Sources: Refinitiv Datastream, ESMA.
{}
Figure 3 Volatility indicators
Note: Implied volatilities of EURO STOXX 50 (VSTOXX) and S&P 500 (VIX), in %.
Sources: Refinitiv Datastream, ESMA.
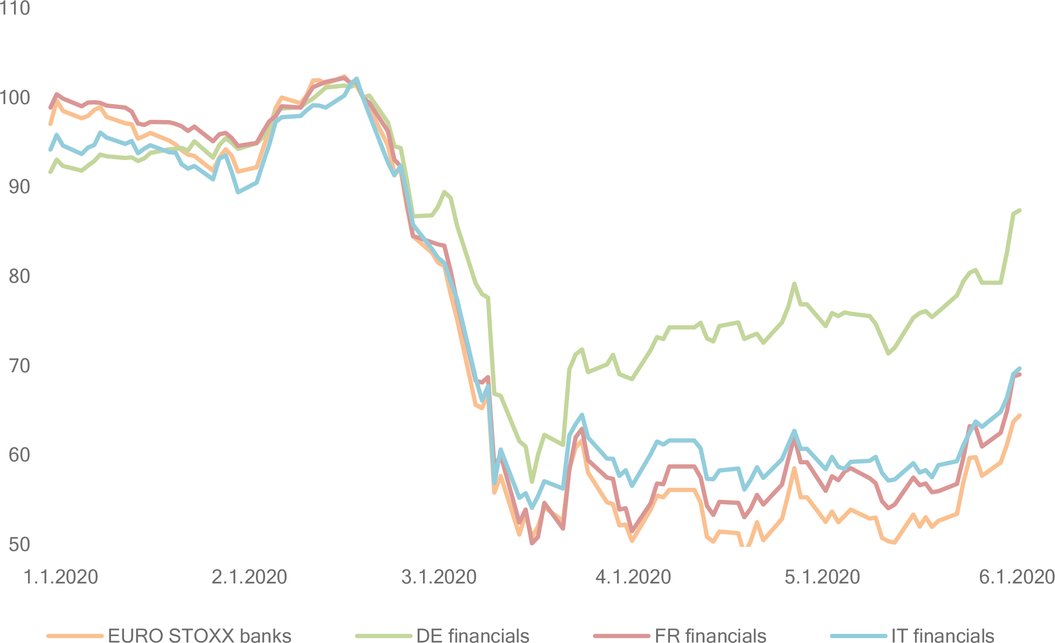
Figure 4 EU financial stock indices
Note: Equity prices. 2.2.2020 = 100.
Sources: Refinitiv Datastream, ESMA.
This is a line chart showing financial indices over time.
Figure 5 EU CDS spread indices
Note: CDS spreads on European IG corporates (iTraxx Europe), European HY corporates (iTraxx Europe Crossover) and European Financials, in bps.
Sources: Refinitiv EIKON, ESMA.
\begin{array}{l|r} \hline \text{Percentage change since 20.2.2020} \\ \hline \text{STOXX EUROPE 800 ex. Switzerland} & -15.78 \\ \hline \text{EURO STOXX INDEX} & -12.72 \\ \hline \text{EURO STOXX 50} & -13.07 \\ \hline \text{AT} & -23.30 \\ \hline \text{BE} & -14.86 \\ \hline \text{BG} & -15.69 \\ \hline \text{CY} & -34.73 \\ \hline \text{CZ} & -13.94 \\ \hline \text{DE} & -7.32 \\ \hline \text{DK} & -2.48 \\ \hline \mathrm{EE} & -13.16 \\ \hline \text{ES} & -21.88 \\ \hline \text{FI} & -8.66 \\ \hline \text{FR} & -15.91 \\ \hline \text{GB} & -13.93 \\ \hline \text{GR} & -26.64 \\ \hline \text{HR} & -17.16 \\ \hline \text{HU} & -17.83 \\ \hline \text{IE} & -12.90 \\ \hline \text{IS} & -4.44 \\ \hline \text{IT} & -20.01 \\ \hline \text{LT} & -1.98 \\ \hline \text{LU} & -21.60 \\ \hline \text{LV} & -1.81 \\ \hline \text{MT} & -12.92 \\ \hline \text{NL} & -9.17 \\ \hline \text{NO} & -10.22 \\ \hline \text{PL} & -13.47 \\ \hline \text{PT} & -13.64 \\ \hline \text{RO} & -11.45 \\ \hline \text{SE} & -9.47 \\ \hline \text{SI} & -10.83 \\ \hline \text{SK} & 0.07 \\ \hline \end{array}
Figure 6 European stock indices performance per country
Note: Data as of 4.6.2020.
Sources: Refinitiv EIKON; ESMA.
\text{Line chart showing financial sector trends from 5.1.2018 to 5.1.2020 for Banks, Financial services, Insurance, and Non-financial corporation.}
Figure 7 Correlation between daily returns of the Euro Stoxx Europe 600 and the related sectorial indices
Note: Correlations between daily returns of the STOXX Europe 600 and STOXX Europe 600 sectoral indices. Calculated over 60-day rolling windows.
Sources: Refinitiv Datastream, ESMA.
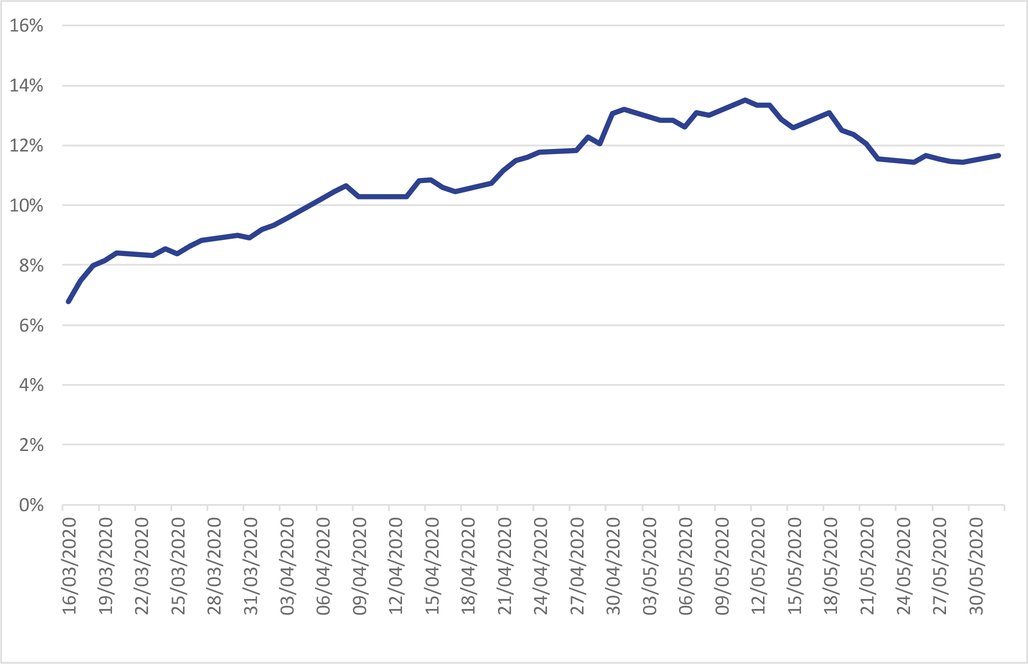
Figure 8 NSP between 0,1 % and 0,2 % over the period 16 March and 1 June 2020
Sources: ESMA.