ANNEX
In this Annex, ‘ESMA decision’ refers to Decision (EU) 2020/525.
Figure 1
Financial indicators
Equity market performance | Changes from 20.2.2020 to 3.9.2020 (in %) | Index level as of 3.9.2020 | Changes from 20.2.2020 to 4.6.2020 (in %) | Index level as of 4.6.2020 |
STOXX EUROPE 800 ex. Switzerland | – 17 | 116 | – 16 | 117 |
EURO STOXX INDEX | – 13 | 362 | – 13 | 364 |
EURO STOXX 50 | – 14 | 3 304 | – 13 | 3 323 |
US S&P500 | 2 | 3 451 | – 8 | 3 112 |
JP Nikkei | 0 | 23 466 | – 3 | 22 864 |
Global | – 1 | 228 | – 9 | 211 |
European banks | – 37 | 93 | – 30 | 104 |
IT financials | – 30 | 27 | – 29 | 28 |
ES financials | – 48 | 34 | – 35 | 42 |
DE financials | – 13 | 123 | – 11 | 126 |
FR financials | – 34 | 118 | – 28 | 130 |
Volatility | Changes from 20.2.2020 to 3.9.2020 (in %) | Index level as of 3.9.2020 | Changes from 20.2.2020 to 4.6.2020 (in %) | Index level as of 4.6.2020 |
VSTOXX | 15 | 29 | 13 | 28 |
VIX | 18 | 33 | 9 | 25 |
Credit Default Swaps | Changes in bps from 20.2.2020 to 3.9.2020 | CDS spreads in bps as of 3.9.2020 | Changes in bps from 20.2.2020 to 4.6.2020 | CDS spreads in bps as of 4.6.2020 |
Europe corporate | 5 | 45 | 22 | 62 |
Europe high yield | 92 | 290 | 157 | 355 |
Europe financials | 15 | 59 | 29 | 73 |
Europe financials subordinate | 38 | 124 | 62 | 149 |
10Y Government bonds | Changes in bps from 20.2.2020 to 3.9.2020 | Bond yields in % as of 3.9.2020 | Changes in bps from 20.2.2020 to 4.6.2020 | Bond yields in % as of 4.6.2020 |
DE10Y | – 5 | – 0,49 | 15 | – 0,29 |
ES10Y | 9 | 0,33 | 32 | 0,55 |
FR10Y | 2 | – 0,19 | 23 | 0,01 |
IT10Y | 15 | 1,06 | 51 | 1,42 |
US10Y | – 90 | 0,62 | – 67 | 0,86 |
GB10Y | – 34 | 0,24 | – 24 | 0,34 |
JP10Y | 8 | 0,04 | 9 | 0,05 |
Note: Equity market changes expressed in relative terms, other changes in absolute terms. Sources: Refinitiv EIKON, ESMA. | ||||
\text{The image is a line chart showing the evolution of VSTOXX and VIX indices from 01-Jan to 26-Aug, with annotations related to ESMA's decisions on 16 March 2020 and 11 June 2020.}
Figure 2 Volatility indicators
Note: Implied volatilities of EURO STOXX 50 (VSTOXX) and S&P 500 (VIX), in %.
Sources: Refinitiv Datastream, ESMA.
\text{STOXX Europe Indices Performance (01-Jan to 02-Sep 2020)}
Figure 3 EU sectoral stock indices
Note: Equity prices. 20.2.2020 = 100.
Sources: Refinitiv Datastream, ESMA.
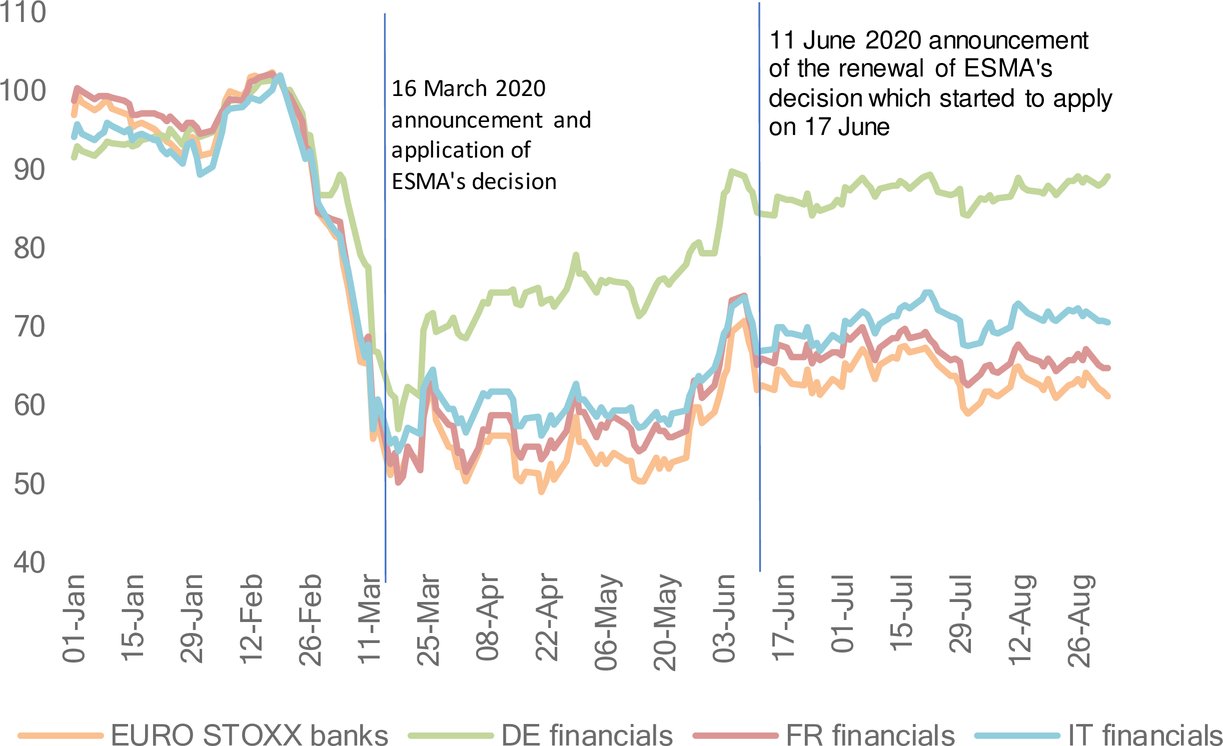
Note: Equity prices. 20.2.2020 = 100.
Sources: Refinitiv Datastream, ESMA.
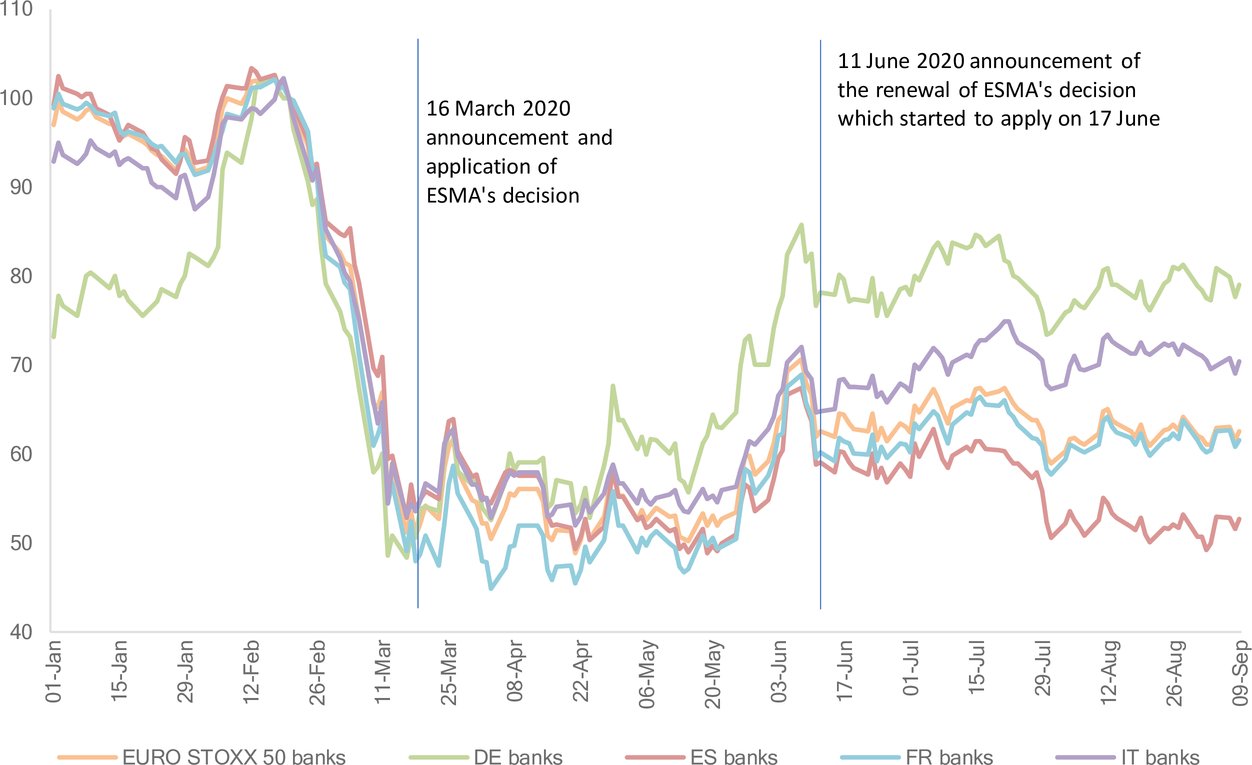
Note: Equity prices. 20.2.2020 = 100.
Sources: Refinitiv Datastream, ESMA.
Figure 4
EU CDS spread indices
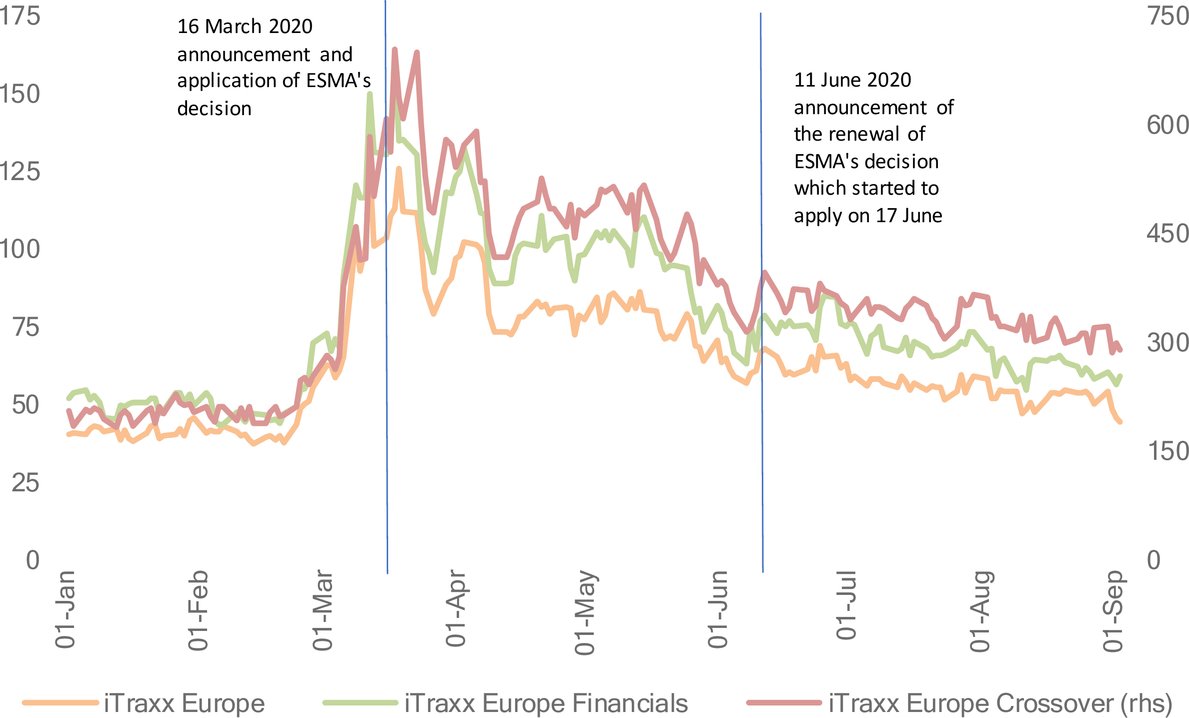
Note: CDS spreads on European IG corporates (iTraxx Europe), European HY corporates (iTraxx Europe Crossover) and European Financials, in bps.
Sources: Refinitiv EIKON, ESMA.
Figure 5
European stock indices performance per country
Percentage change from 20.2.2020 to 3.9.2020 | Percentage change from 20.2.2020 to 4.6.2020 | |
STOXX EUROPE 800 ex. Switzerland | – 16,67 | – 15,78 |
EURO STOXX INDEX | – 13,22 | – 12,72 |
EURO STOXX 50 | – 13,57 | – 13,07 |
AT | – 30,21 | – 23,30 |
BE | – 19,22 | – 14,86 |
BG | – 20,67 | – 15,69 |
CY | – 39,52 | – 34,73 |
CZ | – 17,81 | – 13,94 |
DE | – 4,44 | – 7,32 |
DK | 4,24 | – 2,48 |
EE | – 13,55 | – 13,16 |
ES | – 29,45 | – 21,88 |
FI | – 5,35 | – 8,66 |
FR | – 17,37 | – 15,91 |
GB | – 21,32 | – 13,93 |
GR | – 29,24 | – 26,64 |
HR | – 19,61 | – 17,16 |
HU | – 24,05 | – 17,83 |
IE | – 13,00 | – 12,90 |
IS | – 1,50 | – 4,44 |
IT | – 22,04 | – 20,01 |
LT | 5,06 | – 1,98 |
LU | – 25,92 | – 21,60 |
LV | 5,53 | – 1,81 |
MT | – 20,80 | – 12,92 |
NL | – 11,66 | – 9,17 |
NO | – 11,80 | – 10,22 |
PL | – 15,75 | – 13,47 |
PT | – 20,09 | – 13,64 |
RO | – 10,73 | – 11,45 |
SE | – 7,28 | – 9,47 |
SI | – 13,01 | – 10,83 |
SK | – 7,05 | 0,07 |
Sources: Refinitiv EIKON, ESMA. | ||
Figure 6
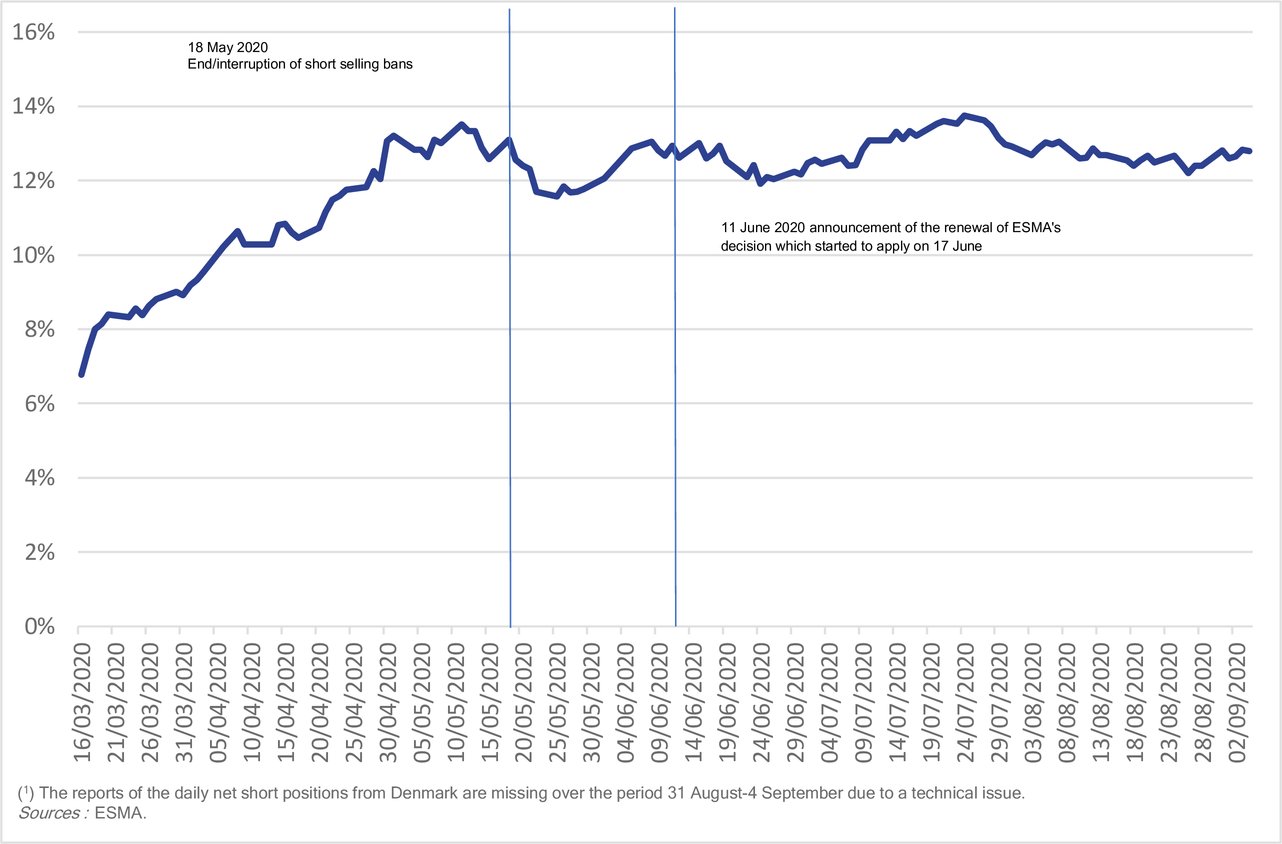
NSP between 0,1 % and 0,2 % over the period 16 March-4 September 2020 (1)