ANNEX
In this Annex, ‘ESMA decision’ refers to the ESMA decision of 16 March 2020 to require natural or legal persons who have net short positions to temporarily lower the notification thresholds of net short positions in relation to the issued shares capital of companies whose shares are admitted to trading on a regulated market above a certain threshold to notify the competent authorties in accordance with point (a) of Article 28(1) of Regulation (EU) No 236/2012.
Figure 1
Financial indicators
Equity market performance | Changes from 20.2.2020 to 2.12.2020 | Index level as of 2.12.2020 | Changes from 20.2.2020 to 3.9.2020 | Index level as of 3.9.2020 | Changes from 20.2.2020 to 4.6.2020 | Index level as of 4.6.2020 |
STOXX EUROPE 800 ex. Switzerland | -10 % | 125 | -17 % | 116 | -16 % | 117 |
EURO STOXX INDEX | -6 % | 392 | -13 % | 362 | -13 % | 364 |
EURO STOXX 50 | -8 % | 3 521 | -14 % | 3 304 | -13 % | 3 323 |
US S&P500 | 9 % | 3 663 | 2 % | 3 451 | -8 % | 3 112 |
CSI 300 | 22 % | 5 067 | 16 % | 4 817 | -4 % | 3 982 |
JP Nikkei | 14 % | 26 801 | 0 % | 23 466 | -3 % | 22 864 |
Global | 8 % | 248 | -1 % | 228 | -9 % | 211 |
European banks | -22 % | 115 | -37 % | 93 | -30 % | 104 |
IT financials | -24 % | 29 | -30 % | 27 | -29 % | 28 |
ES financials | -24 % | 50 | -48 % | 34 | -35 % | 42 |
DE financials | -7 % | 132 | -13 % | 123 | -11 % | 126 |
FR financials | -21 % | 141 | -34 % | 118 | -28 % | 130 |
Volatility | Changes from 20.2.2020 to 2.12.2020 | Index level as of 2.12.2020 | Changes from 20.2.2020 to 3.9.2020 | Index level as of 3.9.2020 | Changes from 20.2.2020 to 4.6.2020 | Index level as of 4.6.2020 |
VSTOXX | 8 % | 22 | 15 % | 29 | 13 % | 28 |
VIX | 5 % | 21 | 18 % | 33 | 9 % | 25 |
Credit Default Swaps | Changes in bps from 20.2.2020 to 2.12.2020 | CDS spreads in bps as of 2.12.2020 | Changes in bps from 20.2.2020 to 3.9.2020 | CDS spreads in bps as of 3.9.2020 | Changes in bps from 20.2.2020 to 4.6.2020 | CDS spreads in bps as of 4.6.2020 |
Europe corporate | 5 | 45 | 5 | 45 | 22 | 62 |
Europe high yield | 53 | 251 | 92 | 290 | 157 | 355 |
Europe financials | 9 | 53 | 15 | 59 | 29 | 73 |
Europe financials subordinate | 13 | 100 | 38 | 124 | 62 | 149 |
10Y Government bonds | Changes in bps from 20.2.2020 to 2.12.2020 | Bond yields in % as of 2.12.2020 | Changes in bps from 20.2.2020 to 3.9.2020 | Bond yields in % as of 3.9.2020 | Changes in bps from 20.2.2020 to 4.6.2020 | Bond yields in % as of 4.6.2020 |
DE10Y | -8 | -0,52 | -5 | -0,49 | 15 | -0,29 |
ES10Y | -13 | 0,11 | 9 | 0,33 | 32 | 0,55 |
FR10Y | -7 | -0,29 | 2 | -0,19 | 23 | 0,01 |
IT10Y | -31 | 0,60 | 15 | 1,06 | 51 | 1,42 |
US10Y | --57 | 0,95 | -90 | 0,62 | -67 | 0,86 |
GB10Y | -22 | 0,36 | -34 | 0,24 | -24 | 0,34 |
JP10Y | 7 | 0,03 | 8 | 0,04 | 9 | 0,05 |
Note: Equity market changes expressed in relative terms, other changes in absolute terms. Sources: Refinitiv EIKON; ESMA. | ||||||
\text{The image shows a time series plot comparing the VSTOXX and VIX indices in 2020, with vertical reference lines for ESMA's announcement dates.}
Figure 2 Volatility indicators
Note: Implied volatilities of EURO STOXX 50 (VSTOXX) and S&P 500 (VIX), in %.
Sources: Refinitiv Datastream, ESMA.
\text{No formula present in the provided image; the image displays a time-series line chart showing financial index values (STOXX Europe 600) throughout 2020 with annotations for ESMA decisions.}
Figure 3 EU sectoral stock indices
Note: Equity prices. 2020-02-20 = 100.
Sources: Refinitiv Datastream, ESMA.
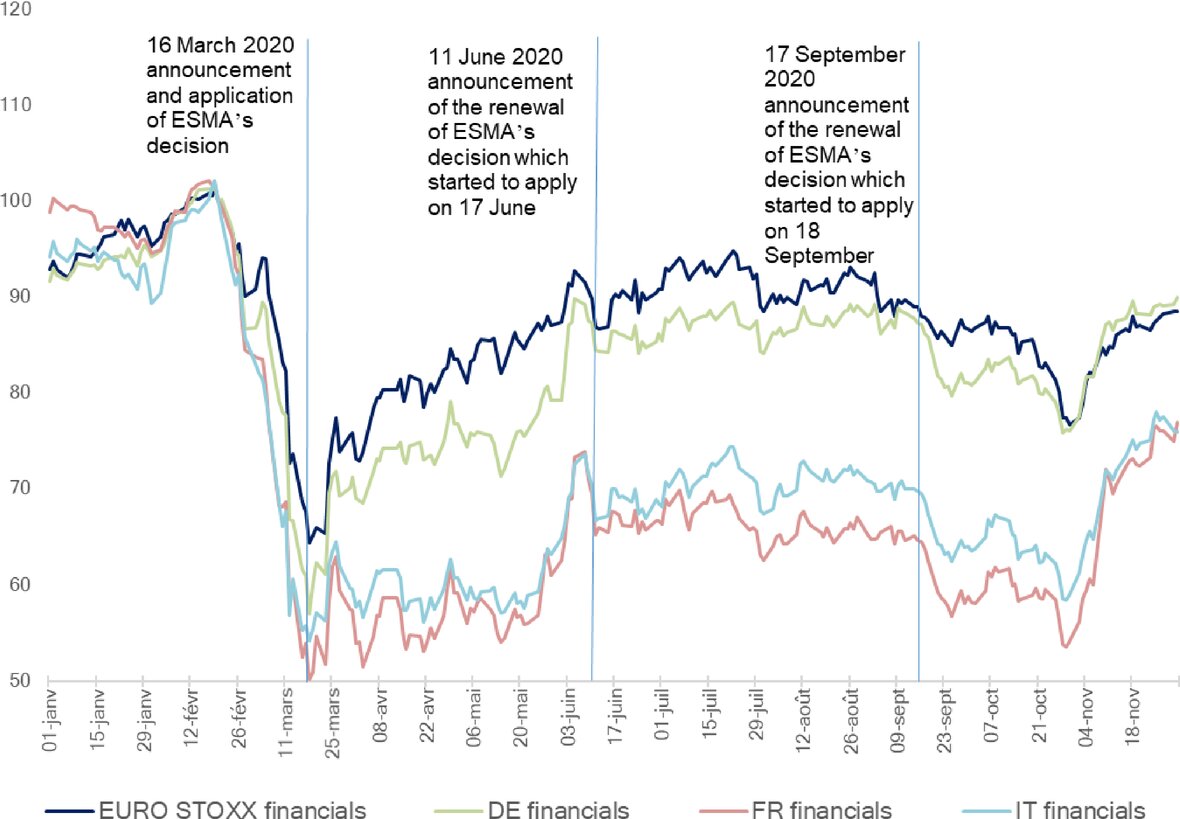
Note: Equity prices. 2020-02-20 = 100.
Sources: Refinitiv Datastream, ESMA.
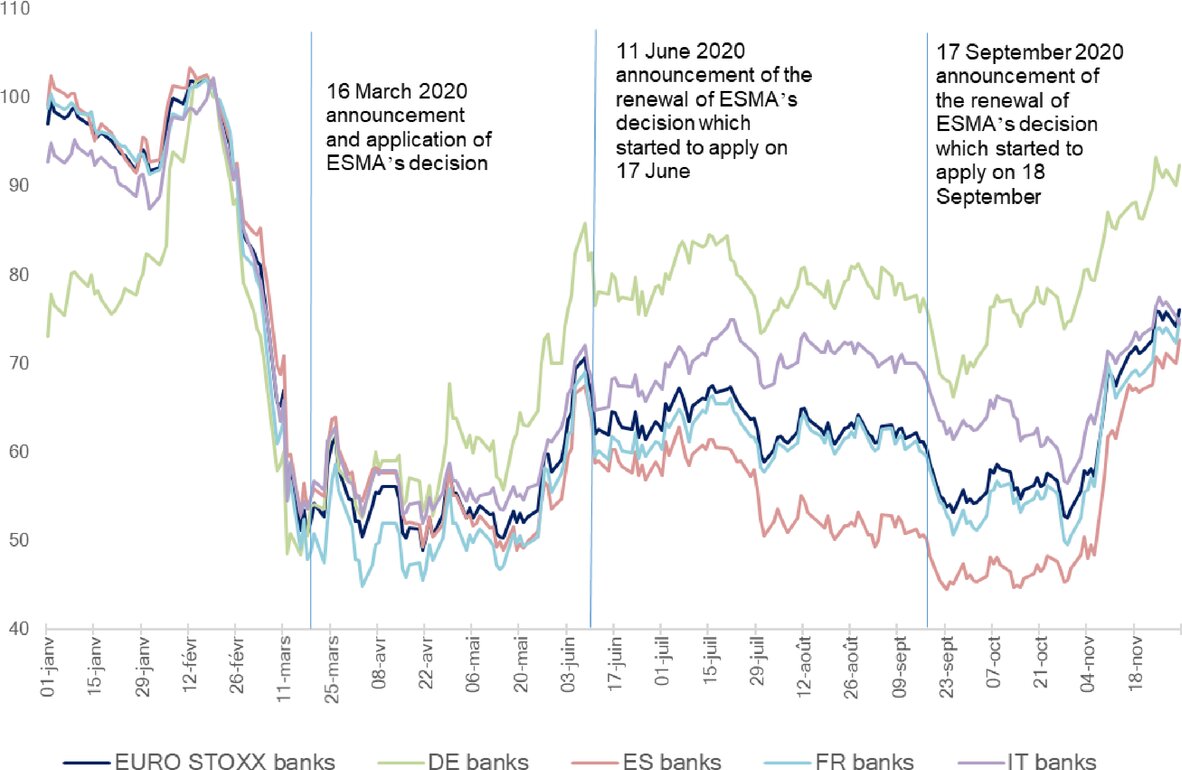
Note: Equity prices. 2020-02-20 = 100.
Sources: Refinitiv Datastream, ESMA.
\text{No formula present in the provided image.}
Figure 4 EU CDS spread indices
Note: CDS spreads on European IG corporates (iTraxx Europe), European HY corporates (iTraxx Europe Crossover) and European Financials, in bps.
Sources: Refinitiv EIKON, ESMA.
Figure 5
European stock indices performance per country
Percentage change from 6 Nov 2020 to 2 Dec 2020 | Percentage change from 20 Feb 2020 to 2 Dec 2020 | Percentage change from 20 Feb 2020 to 3 Sep 2020 | Percentage change from 20 Feb 2020 to 4 June 2020 | |
STOXX EUROPE 800 ex. Switzerland | 8,67 % | -9,74 % | -16,67 % | -15,78 % |
EURO STOXX INDEX | 9,41 % | -6,06 % | -13,22 % | -12,72 % |
EURO STOXX 50 | 9,90 % | -7,89 % | -13,57 % | -13,07 % |
AT | 21,10 % | -17,84 % | -30,21 % | -23,30 % |
BE | 16,24 % | -9,94 % | -19,22 % | -14,86 % |
BG | 0,55 % | -22,03 % | -20,67 % | -15,69 % |
CY | 25,10 % | -27,80 % | -39,52 % | -34,73 % |
CZ | 11,15 % | -12,35 % | -17,81 % | -13,94 % |
DE | 6,68 % | -2,57 % | -4,44 % | -7,32 % |
DK | -1,90 % | 10,16 % | 4,24 % | -2,48 % |
EE | 11,25 % | -4,72 % | -13,55 % | -13,16 % |
ES | 19,66 % | -17,22 % | -29,45 % | -21,88 % |
FI | 6,38 % | 1,96 % | -5,35 % | -8,66 % |
FR | 12,54 % | -7,91 % | -17,37 % | -15,91 % |
GB | 9,36 % | -13,09 % | -21,32 % | -13,93 % |
GR | 29,14 % | -16,82 % | -29,24 % | -26,64 % |
HR | 10,22 % | -13,43 % | -19,61% | -17,16 % |
HU | 10,74 % | -14,42 % | -24,05 % | -17,83 % |
IE | 5,56 % | -0,58 % | -13,00 % | -12,90 % |
IS | 5,78 % | 10,90 % | -1,50 % | -4,44 % |
IT | 11,64 % | -12,39 % | -22,04 % | -20,01 % |
LT | 4,44 % | 3,84 % | 5,06 % | -1,98 % |
LU | 14,85 % | -7,78 % | -25,92 % | -21,60 % |
LV | -0,47 % | 6,81 % | 5,53 % | -1,81 % |
MT | 15,14 % | -13,86 % | -20,80 % | -12,92 % |
NL | 6,64 % | -1,80 % | -11,66 % | -9,17 % |
NO | 11,02 % | -3,37 % | -11,80 % | -10,22 % |
PL | 11,81 % | -9,62 % | -15,75 % | -13,47 % |
PT | 14,45 % | -14,54 % | -20,09 % | -13,64 % |
RO | 6,43 % | -7,58 % | -10,73 % | -11,45 % |
SE | 5,47 % | 1,06 % | -7,28 % | -9,47 % |
SI | 8,13 % | -9,57 % | -13,01 % | -10,83 % |
SK | -0,99 % | -3,02 % | -7,05 % | 0,07 % |
Sources: Refinitiv EIKON; ESMA. | ||||
\text{No formula present in the image.}
Figure 6 NSP between 0,1 % and 0,2 % over the period 16 March 2020 – 30 November 2020
Sources:ESMA